A moving average (MA) smooths price into a single flowing line so you can see the trend beneath the noise.
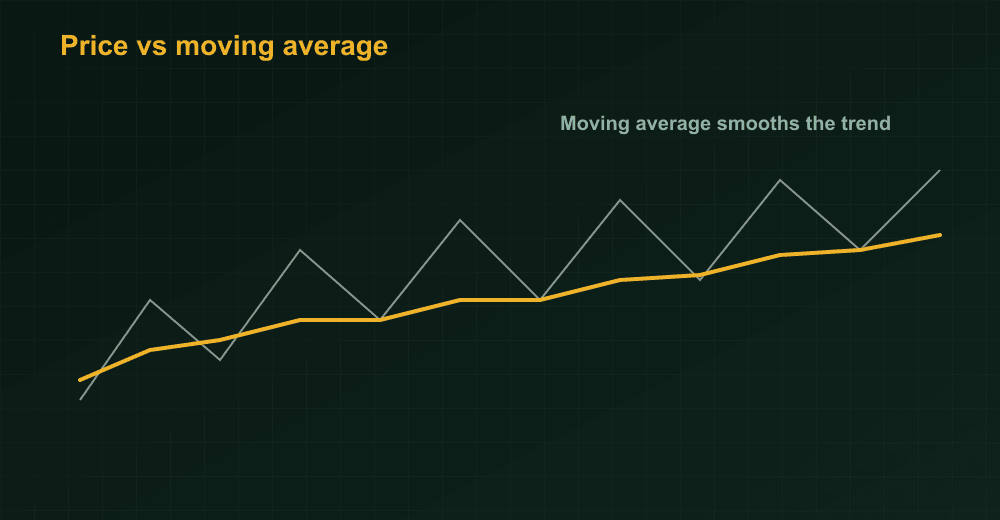
SMA vs EMA
The SMA (simple) averages the last N closes equally. The EMA (exponential) weights recent prices more, so it reacts faster.
Common periods
- 50-day — medium-term trend.
- 200-day — long-term trend; price above it is broadly bullish.
Crossovers
When a short MA crosses above a long one it’s a golden cross (bullish); crossing below is a death cross (bearish).
Key idea: Moving averages lag price — they confirm trends rather than predict them. Use them with support/resistance.
Key takeaways
- MAs smooth price into a trend line.
- EMA reacts faster than SMA.
- 50 and 200-day are the most-watched.
- Golden/death crosses signal trend shifts — with lag.
Practise this free on StockYatra
Open a free account, get 10,000 virtual coins and trade live-simulated NEPSE & Indian markets with zero real-money risk.