A candlestick packs four numbers — open, high, low and close — into one shape. Read a row of them and you see the battle between buyers and sellers.
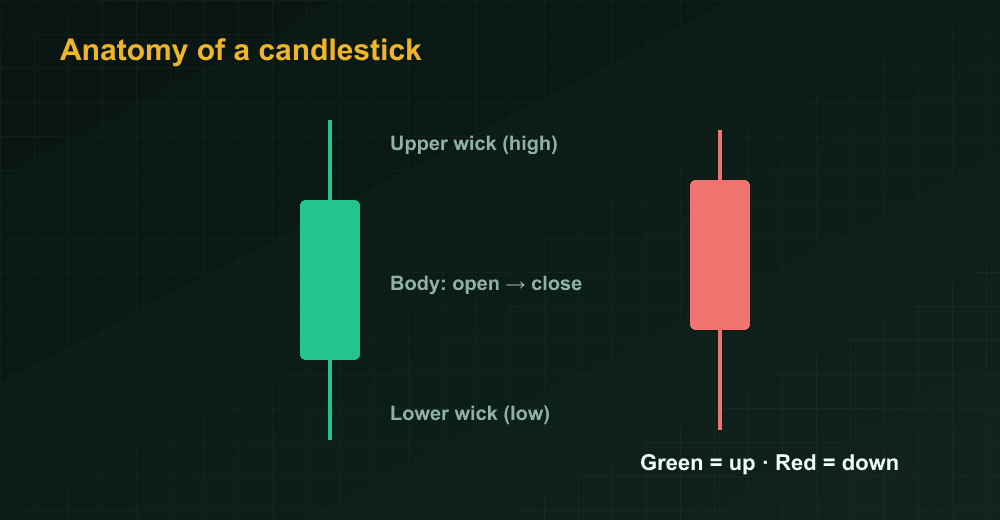
Key idea: A long body shows conviction. Long wicks show rejection — price tried to go somewhere and got pushed back.
Bullish patterns
- Hammer — small body, long lower wick after a decline.
- Bullish engulfing — a big green candle covering the prior red one.
- Morning star — a three-candle bottoming reversal.
- Piercing line — a green candle closing above the midpoint of the prior red one.
Bearish patterns
- Shooting star — small body, long upper wick after a rally.
- Bearish engulfing — a big red candle swallowing the prior green.
- Evening star — the bearish mirror of the morning star.
- Doji — open and close nearly equal: indecision.
How to use them
Patterns are hints, not guarantees. A hammer at a known support level is far stronger than one in the middle of nowhere. Combine candlesticks with support/resistance and volume, and confirm before you act.
Key takeaways
- A candle shows open, high, low, close at a glance.
- Bodies show conviction; wicks show rejection.
- Learn a few reliable patterns, not dozens of rare ones.
- Always read patterns in the context of trend and key levels.
Practise this free on StockYatra
Open a free account, get 10,000 virtual coins and trade live-simulated NEPSE & Indian markets with zero real-money risk.